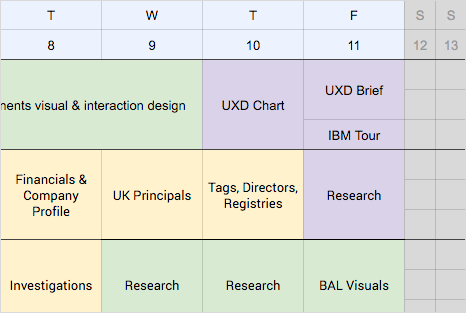

Our team was in need of an effective and easy way to show who was working on what. After a bit of digging, I decided a Gantt Chart would fit our needs the best. A Gantt chart (a type of bar chart) is a visual representation of a project schedule.
I designed a custom Gantt Chart template using Google Docs (allows everyone to work together, in the same doc, at the same time). The Gantt Chart was helpful for leaders and peers to quickly understand how resources were getting assigned, assess priorities, and keep things transparent. The minimal in-line commenting made it super simple for designers to enter their tasks. The process was pretty liberal, designers entered tasks on their own accord. Some would enter tasks in advance, the day of, or a week after completion. I also included a ‘Project Requests’ section below the chart to inform everyone of potential and upcoming projects.
If you’re interested in trying this out on your own team. Here’s a FREE Project Schedule Template to get you started.